
Following up on my analysis from Part 1 of our 2018 lookback, we’re going to look at turnout statistics for the 2018 general elections by county, compared to prior turnout numbers, to give you a better idea of what happened in the elections as the 2020 presidential race quickly approaches.
Turnout was way up this past year compared to other gubernatorial years, where turnout averages 3.3 million voters or about 45% of the electorate. 2018 drew a turnout of 4.3 million voters, a turnout of 58%, which is only slightly less than 500,000 voters than the last presidential election. The average turnout for counties that voted for Schuette was 61%, while Whitmer Counties voted at 59%. However, counties that favored Whitmer accounted for about 67% of the vote. And those counties were particularly lopsided compared to total Republican votes in the presidential election of 2016.
After reviewing the total turnout per party for the state Board of Education races, which usually perform close to the partisan base, the combined vote total for Republicans and Democrats was down 13% from 2016, however, by party, Republicans vote was down 19% compared to 7% for Democrats, a 12 point difference compared to a 9 point difference favoring Republicans in 2014 compared to 2012, but nowhere near as lopsided as the 30 point difference in 2010 compared to 2008. 2018 was a good year for Michigan Democrats, but not a wave. In 2010, Snyder won in 81 house seats, compared to Whitmer winning 56 this year. Turnout was strong amongst both parties but Democrats turned out better.
What helped Republicans prevent a true blowout was that in traditionally strong Wayne county both the parties were down about 18%, which would be normal in most midterm elections. However, the truly frightening news for Republicans was their performance in Oakland County where they lost by 21.5% – a similar margin to Washtenaw County, which is far more liberal. Across the state, it was pretty lopsided everywhere as Republicans weren’t motivated. In some cases, it was continuing the nearly 40-year tradition of switching from supporting Republicans to a Democrat during a gubernatorial election. Furthermore, even in the most Republican counties of Northern Michigan, Republicans still averaged about a 9 point gap.
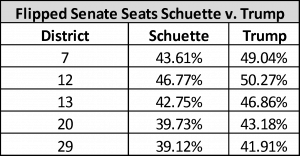
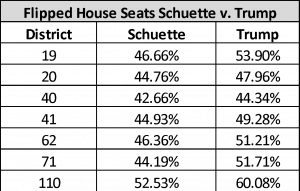
Legislatively speaking, the Democrats made strong gains in both chambers, though going into the cycle those expectations certainly did exist. Back in October, I read an article in which Trump was still popular, but had shed about 5% of his supporters. Taking that into account, it is easy to understand the trouble for Republicans in Oakland County and Western Wayne where Trump barely won or barely lost certainly puts those seats in the crosshairs. Losing 5% for Trump, who carried 67 House seats and Senate seats in 2016, wouldn’t hurt so much. As it turns out though, Schuette performed about 5% less than Trump and won just 54 House seats and 19 Senate seats.
With strong incumbents, Republicans were able to hold on to majorities, as there were certainly a few other opportunities for Democrats to make greater gains. In some races, Democrats were severely outraised, or simply didn’t have the best candidate for the demographic.
About the Author: Brian Began is the Elections and Research Director at Grassroots Midwest, Michigan’s only bipartisan advocacy firm.